Starters to Assess Previous Learning

This post serves as a place to record various starters I have used to assess previous learning that I want to draw on in that day’s lesson.

Similar vs congruent (from IM Grade 8 unit 2)

I was doing a demo lesson in a classroom I had not been in, and I needed to make sure they understood the mathematical terms similar and congruent. One of my favorite moves for this is a Stand and Talk because I don’t need to know if the one person who raises their hand knows it. I need everybody to know it. I like this better than “Tell your elbow partner…” because it increases the energy level in the room and gets all the wiggles out before we begin. So this was the stand and talk I used, and how it went:

Stand and Talk- “Partner A, explain to your partner what it means for two shapes to be congruent. Together find a sample of congruent things in the classroom.” Then, with the class still standing, I had pairs share objects they found. “Class, do you agree?”

“Partner B, explain what it means for two shapes to be similar. Together find a pair of similar things in the classroom.”

As I circulated and listened, I immediately realized they were not using the mathematical definition of similar with precision. For instance, I heard “an 89-degree angle is similar to a 90-degree angle”. I paused the class, pointed out an anchor poster on similarity. “In math, the definition of similar is more specific than how the word is normally used in English.” I asked them to revise their answers to this level of specificity. As I circulated I heard most groups now using the correct definition, and thinking more strenuously about their examples around the room. To conclude, with the class still standing, I had pairs share objects they found. “Class, do you agree?” As we moved from example to example I emphasized “same exact shape” and “different sized”. This whole class opener took less than 10 minutes.

As students returned to their seats, one student raised their hand and asked, “Are they allowed to be the same size? So can congruent things count as similar also?” I asked the class what they thought about this. After a few students shared their thoughts I asked, “If we let congruent things count as similar, what would the scale factor be?” Since this comes up on the unit test, I was very happy to correct my overgeneralization.

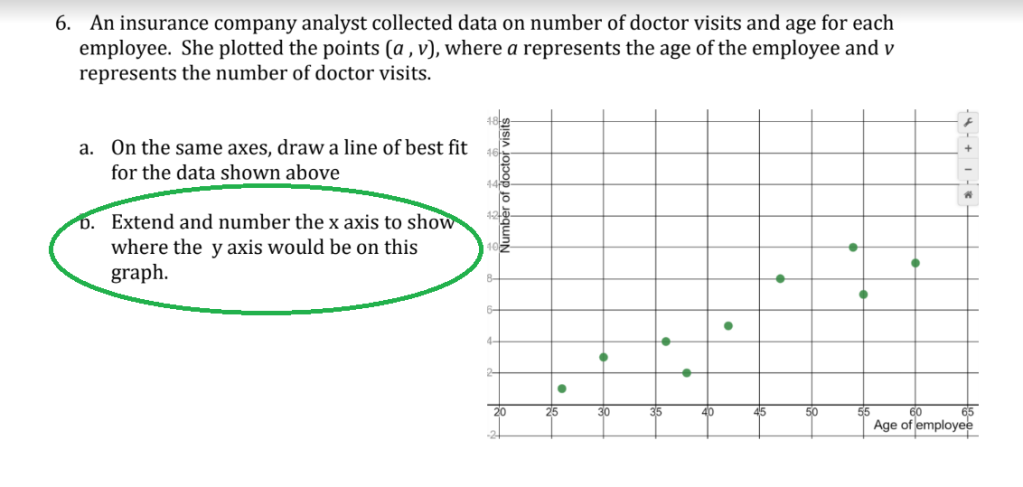
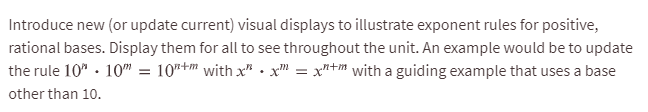
Plotting points (from IM Grade 8 Unit 3)

As I began Unit 3 in my 8th-grade summer school class, I knew that being able to correctly plot points was going to be essential to success. The readiness Check had showed me this was going to be an issue for many of my students. So before class, I put blue painter’s tape down on the floor to create axes, and put 3 by 5 cards with the point that named their location on a few desks. As students begin to arrive I let in 3 students at a time, telling them they got to pick their seat but had to name it correctly with its point label before they could be seated. When they gave me an ordered pair, I pointed out where that seat would be located. If that was not where they intended, they could go to the back of the line and try again. In about 8 minutes, everyone was in the room and seated, and I was pretty confident they knew how to name a point on that particular axes. I checked by asking them to discuss with their partner the point name for an empty desk near the front. Since the lesson was going to contain many opportunities to plot points on paper and on whiteboards, we began our first lesson without further discussion.

Quadrilateral names (from IM Grade 8 unit 2)

The lesson of the day was going to discuss similarity in various quadrilaterals, using correct mathematical names for these shapes. Since these names had not come up yet this year, I was uncertain whether words like parallelogram and rhombus would be meaningful to the students in front of me that day. In the five minutes before class began, the teacher and I rummaged the room for any solid of consistent length. We found a bin of base ten blocks and pulled out all the rods. When students came in, they found 6 rods sitting on their desk.

“Use the rods in front of you to build a parallelogram”

“Can you build a different parallelogram? You can work with your elbow partner if you need more rods.”

(continued on with rectangle, rhombus, square.)

One of my favorite surprise moments was when a couple pairs of students built a hexagon when I asked for a different parallelogram.

Tell me more about why this might count as a parallelogram.

Well, opposite pairs of sides are parallel…

This whole activity offered so many chances to clarify and tie up some unfinished learning. And because the lesson immediately applied these definitions, no extra day of review practice was needed.

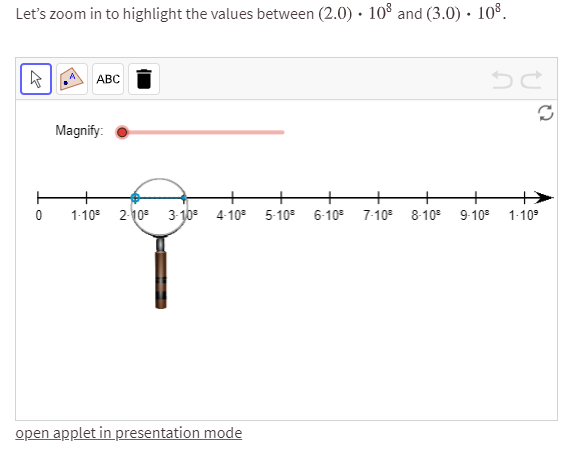
Unit Circle values (from Math 3 trig unit)

This day I was modeling a desmos lesson in a Math 3 classroom. The class had already learned about finding trig values using the unit circle, but as we begin the lesson, I could see it was definitely not a skill they felt confident with yet. The first period I launched into a quick mini-lecture, which managed both to bore everyone and also not really accomplish what I intended. For the second period, I tried a Stand and Talk instead, and it was magical. Read more about this opener here.

Day two of a unit in math 3 (from Math 3 conics unit)

This block day I was modeling a complex activity-based lesson on deriving the formula for a parabola from the formal definition involving focus and directrix. I had four teachers observing the lesson and only one of the adults in the room really knew the students. The first day of the unit had been a traditional coverage of the equation of a circle. To gain a little insight into the students in front of me, I prepared a 3-2-1 homework review sheet and handed it out as they came in.

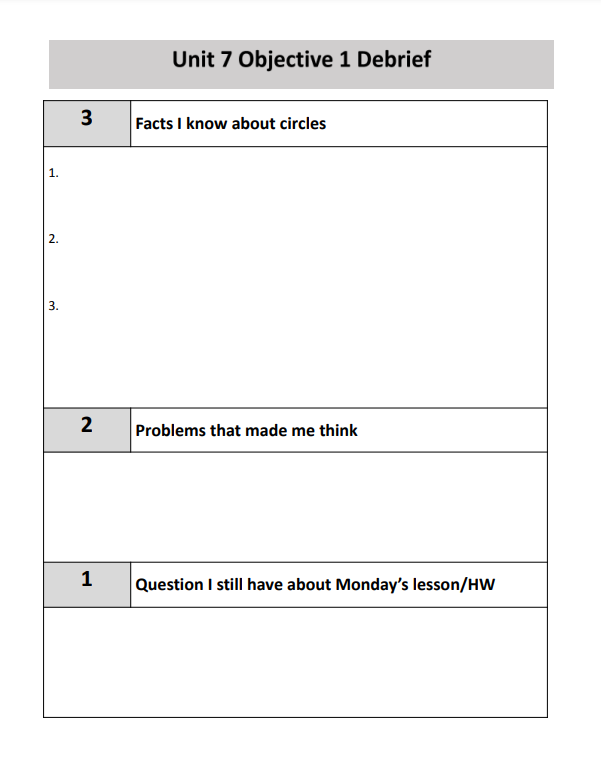
After a few minutes of quiet writing, I begin scribing a list of everything they knew about circles. Tons of vocabulary came out and I had them explain it all, or tell me what to draw to illustrate it. The formula they learned the previous day came up, but so did area and circumference formulas and just about anything I might have wanted to “fill in” for students who were struggling with unfinished learnings.

Next I asked for students to share problems that really made them think, but they eventually figured it out. A sample conversation:

#13

What was weird about #13?

They gave you a diameter.

And you didn’t want a diameter?

No. I wanted a radius.

Ahh. yeah, So what did you figure out?

I figured out that if I divide the diameter in half I will have the length of the radius.

Oh, great thinking! Did anyone else notice that tricky spot?

When we got to “One question you still have”, the only question remaining was deeper than the norm. “I don’t understand how circle equations relate to the conics intro video we watched yesterday.” Perfect! since I hadn’t seen or even known there was a video, I let their teacher take that one. Perfect intro to our work that day, and I have gotten a great peek at their thinking and things I might connect to during the lesson.

Hearing Student Voice Thanks to Better Questions

So true confessions: classroom discipline was never my strength. How many times did I wish for a class that would just BE QUIET, let me tell them how I wanted them to do the math, and then replicate my process without complaint?

Fast forward to now, as I watch silent classrooms with student faces hidden and wonder “What are they thinking? Are they following? Does what the teacher is saying make sense to them?” And the uploaded photo of perfect mathematical procedure does not comfort me at all.  Did they get it or am I just looking at photomath in all its glory?  If I could only know what’s happening inside those student brains!

Because if pandemic teaching has shown me anything, it is that my early dreams of silent studious classrooms where all students absorbed my thinking like a sponge and regurgitated it on command is

  1. Not possible.
  2. Not what I want.

 Students do not work that way. Learning doesn’t work that way.  

Currently I work as part of a team of teacher coaches, supporting new hires through the state mandated Induction Program (formerly known as BTSA). Our new teachers each choose a teaching practice to focus on for the semester. There are almost 40 separate teaching practices that these young teachers can choose from. This fall almost every one of them chose CSTP 5.2: “Collecting and analyzing assessment data from a wide variety of sources to inform instruction.”  

Because we all felt it – the need to know what our students were thinking, what they understood and didn’t understand. We could not plan or teach without this vital information. 

Fast forward through this semester. Some teachers have found more successful ways of hearing what students are thinking than others. Teachers who haven’t found ways to hear where students are at and what they are thinking are for the most part frustrated.  They have a segment who seem to be learning and some that are turning in garbage, or nothing at all. And even for the students who are doing well, the nagging doubt remains about whether the work truly represents their own mastery of the material or just what some app tells them. 

I have thought alot about what choices made the difference. Some tech platforms are great tools for gaining insight into student understanding. But the bottom line seems to be the questions we ask. Teachers getting better glimpses into student thinking aren’t just using better tech. They are asking better questions.  

Writing better questions is a skill that can be learned.  We are used to asking for answers, and which it turns out is pretty close to useless in assessing student understanding. We are all learning to question better, but between learning new tech, planning new lessons, creating distance resources, and writing new assessments, teachers have little time to dig deep into honing their question asking skills. 

So here we are – hungry to hear authentic student thinking about mathematics but with zero time to develop curriculum and assessments that give us an opportunity to hear and build instructional experiences based on those student ideas. 

This is why I am so grateful for the new curriculums we have adopted.  Middle school’s Illustrative Mathematics and high school’s CPM curriculums are built to elicit conversation and give us an opportunity to hear what students understand and where they are struggling. So different from a page of practice problems, they have felt unwelcoming to many teachers who want the familiar 1-29 odd type of experience. But after this year, I realize I want more than just correct answers that photomath can easily give me. What I really want is not just “answer producers”.  I would like math to make sense and to connect to the things students already know in meaningful ways. These curriculums ask those deeper questions, draw connections, and ask students to explain, apply, and reflect on their learning. 

10+ years ago I worked with a talented teacher and mathematician who finally got to teach Advanced Math students.  By the second week she stormed into my room in frustration. “These kids will not think! They keep waiting for me to tell them what to do!”

Those kids were the kids that were good at the system of school math.  And school math for the most part meant replicating other people’s thoughts, not thinking for themselves. 

Maybe it is taking this pandemic to show us just how broken this old vision of school math is.

What’s Working with Distance Learning

This article is from our weekly district newsletter, but I thought what was shared by these teachers deserved a wider audience.

This week’s “What’s Working Around the District” column comes from one of our awesome Math 1 PLCs. They are teaching from CPM’s Integrated Math 1. Going into distance learning many teachers were wondering how CPM could work at a distance.

This team’s answer is: Thanks to Desmos, it works great!

During the week before school started I heard from their PLC that they intended to teach via Desmos.  Week 1 I sent them a list of questions.  Now that they have had a little time to try things out, here’s what they have to say:

From Teacher 1 (year 7 teaching, year 2 teaching CPM)

  • Overall I am extremely satisfied with Desmos and feel inclined to keep up with it after Distance Learning. I am also using it in my Foundations of Math 2 class. Creating lessons is easy, especially considering the ease of typing math and the ability to include graphs, card sorts, etc.
  • I think it has improved my pacing for the CPM lessons. The dashboard makes it easy to see where everyone is at and I can check on them privately in chat if I see they are not moving along with us.  While students are in breakout rooms, I will often go through and leave feedback on some of their Desmos responses. It is also great that we can see all student responses to a specific question at once. It is a super efficient way to gauge whole class understanding.
  • Ironically, I am hearing individual students’ voices more than I did prior to distance learning because it is easier to read 30 responses on one screen than sift through 30 notebooks or notecards.
  • The last thing I will mention is student engagement—they are far more engaged with the interactive Desmos lessons than they would be watching me do direct instruction and taking all their notes from scratch. I feel like most students actually enjoy working through each activity!

From Teacher 2: ( year 14 teaching, year 2 teaching CPM)

  • We are using Desmos for just about everything. We are using it for class lessons/notes and have included the HW assignments as the last 5 or 6 slides to each assignment.
  • Putting the lesson into Desmos for me has been kind of difficult and kind of easy. I think it depends on the type of problem I am inputting. The hard part and what I would love to learn how to do is the coding stuff so I can give feedback to my students. I have played around with it but I can’t get it to work. (Note from me – . . . “can’t get it to work” YET. That’s a pretty advanced user skill. You are doing great!) 
  • I think running a Desmos class is great. I like that I can pace them and keep them all on the slide I need them to work on or give them options to work a head on two or three slides. I also let them do this in break out rooms on zoom. I like that they can input their work and I can follow along on the teacher option to view everyone’s work.

From Teacher 3: ( year 4 teaching, year 2 teaching CPM)

  • Creating the desmos activities were very easy since CPM has Desmos integrated into its etools already. We have been able to do every single problem on desmos and even the labs in 1.1.2 went better on desmos then they did in class last year. CPM provides a lot of great virtual manipulatives and they are easy to input when not provided. I love the different types of problems you can enter using text, latex, pictures, graphs, tables. And the responses can be done using text, math, tables, graphs and sketches. I feel like the students are more inclined to explain their work when there is an obvious input box on desmos versus when it says “explain” at the end of a paragraph in the textbook.
  • We went back and forth about what to use for homework and ended up using desmos for that too. We put the homework problems at the end of the lesson so everything is in one spot for the students and for us to check their work. We are giving them a score per lesson (5 points for classwork, 5 for homework). I graded the first lesson and it didn’t take any longer than it would to grade it on paper. The dashboard makes it easy to check who participated during class. Then I looked at each student’s individual responses and left feedback if there was an incorrect answer, a skipped problem, or misconception. The feedback is great for the students and didn’t take that long to leave. I played around with the computation layer so starting with lesson 1.1.3 the students will receive feedback on their homework problems so they will know if it is correct or incorrect. This will only work for math input answers but it will make grading a lot faster and the students will benefit from the instant feedback. We are using the book problems so we will still include the open response questions which will take a little longer to grade but will prepare them for assessments.
  • Using Desmos in class has been very smooth and so easy for classroom management. I split my monitor screen to have the teacher dashboard on half and zoom on the other half. Then I open the activity from google classroom and enter as a student on my laptop. I share my laptop screen so they can see my student screen and everything I am writing with the annotation tool on zoom. Being able to write all over my screen is great and makes it easier to explain. I have been using breakout rooms every class period and they are going great. Usually I start them off or do one example and then send them out to work together. Being able to see what they are typing or what question they are on makes it easy to see which groups are struggling or who is off-task. After I bring them back I ask for volunteers to answer questions or I call on students based on the answers I see on the teacher dashboard. This allows students who might not have volunteered an opportunity to share their thinking and for me to hear their voice.
  • Another thing to add is that the first slide on Desmos has the agenda for the day, what they need to do right now, and a graph/input box to tell us how they are doing. The students actually fill this out which is nice and they always have something to do while I am admitting students and taking attendance. We pre-pace the activities so the students can’t move past this screen until we are ready. I use the pacing the whole time to keep us together and if I want them to work on a couple questions I’ll open it up while they are in breakout rooms but still have pacing on. 

And an additional note from me:

Our district has not been one to one with devices until distance learning forced us to it. Consequently, most teachers in the district had little to no experience teaching with Desmos before schools closed in the spring. Fortunately, Desmos is built to support teacher and student learning, and the fact that after only 2 weeks of school this team is feeling so comfortable with teaching in this entirely new way is a testimony to the quality of both the curriculum and the technology. Thank you Desmos and CPM for helping keep students and teachers learning during this difficult time!

Interested in learning more about teaching with Desmos? Check out learn.desmos.com

*Making Desmos activities from CPM? Remember CPM materials are copyright protected so either leave out CPM text and images or keep your activity private. Check your teacher edition ebook for premade desmos activities and submit your own creations!

Fall 2020 -Tech Recommendations to Start the Year

My Tech Diet to Start the Year

Desmos Activity Builder and Google slides. That’s it. Focus on building your learning community and not juggling 100 different cool tools.

Next options for adding on might be Google Jam Board, Google Forms, and/or Google Docs.

Tech to start with for students out of class would be Delta Math, Edpuzzle, and even more Desmos, Google Slides, or Google Docs.

Why Google Slides?

Use google slides to assign breakout room groups collaborative work that they can discuss and co-annotate. As they work you can see the writing appear in real time. It looks like this:

Notice that group 7 is not writing, so I will be popping into that room to see what is up. I also was able to take a screen shot of the problem I wanted them to work on and set it as the background of the slide deck, so it was there for each group to reference.

And here is a great way to have students discuss their rough draft attempts on a homework problem so they can revise and refine there efforts. Their improved draft would go in the center rectangle.

If you prefer, label the squares A, B, C, and D and have students put names in the speaker notes. Then you can project their work for discussion while keeping it anonymous.

This template and hundreds of others are available for download for free at http://www.theresawills.com. She also offers great free PD sessions on teaching synchronously at a distance. Strong recommend!

Gallery Walks Anyone?

This Google Slide Deck by @ashleyguerrero is perfect for a gallery walk activity.

Really, Desmos?

Yes really!

Peardeck, Nearpod, and Desmos all give you the ability to pace the class-control what is on everybody’s screen right now, see each student’s work immediately or near immediately. Each has a couple unique bells and whistles, but they all serve the purposes

  1. Classroom pacing/ management at a distance
  2. See student work in real time
  3. Facilitate conversation

Here are some things that cause me to recommend Desmos:

  • it is 100% free forever. You get all the features.
  • it is made for math. It can do other subjects, but it’s math typing tools, graphs, and tables make different math representations simple.
  • It has a whiteboard feature like peardeck and nearpod, but additional whiteboarding backgrounds like graph paper or a coordinate axis, isometric graph paper and circle/polar graph paper
  • the card sort feature is great for activities like those from our IM and CPM curriculums
  • the video tutorials make it simple to learn
  • it is possible to build in self checking feature when they submit answers
  • the built in comment feature lets you send individual students messages in real time or after class and allows students to go back and see later.
  • The built in snap shot feature makes it easy to take screens shots and prepare a teacher presentation using actual student work as class is happening or later if you find a common incomplete understanding you want to address.
  • the calculator is the same one used on our state test. If you have time to think about state test results right now, that practice with the tool is a plus.
  • The starter screen sets they offer are great for helping you begin getting to know your students and building those relationships.

All that being said, if you are a Peardeck pro, have the paid license and don’t know how to use Desmos, starting your year with tech you know is totally reasonable.

But especially for those of you about to learn something new, invest the time learning the one built by math teachers for math teachers.

Just my unsolicited two cents . . .

Remote Learning Resources- 2020

I put together these hyper docs in Spring of 2020, when over one weekend we went from face to face instructors to managers of distance learning opportunities. The subjects highlighted reflect the priorities for the course and the topics that are usually taught during spring semester.

I have been asked to share these resources so many times that I decided it was easier to put them all in one place for easy access.

Integrated Math 1 hyper doc that links to the six pages below. Get copy here
Integrated Math 2 hyper doc that links to the six pages below. Get copy here
Integrated Math 3 hyper doc that links to the six pages below. Get copy here

Find a typo? Please let me know here.

Distance Learning – Upping Your Video Lesson Game

Are you tired? These last six weeks have been a brutal baptism by fire into digital teaching and learning.

I know some of you are doing more than one of these at a time. If that’s you, those slopes are additive, so you are probably at the top of that list. Be comforted that it will never get steeper than this. ☺

One place you may consider upping your game, either now or for the future, is in the way you are recording and delivering content. I spent the week exploring different tech options and found a few that are much easier than what I previously have done, and some that help students to be more interactive and engaged while watching. I took one 8th grade lesson introducing the idea of volume and tried it out with each of the following platforms. (My purpose here is to show off the tech, so forgive less than optimal teaching.  Also, I committed to posting my first product for each platform, so you could see the way it might actually come out without spending a week of redoing and perfecting. All that to say, watch with grace.)

Record in Powerpoint: The record feature in Powerpoint makes editing or adding to your video a breeze.  Your speech and animation clicks are captured and saved slide by slide. Done and realize something you forgot? Add a slide and record whatever talk goes with it. Mess something up? Don’t start over. Just re-record that one slide. In the end, it can be converted to a single video. 

original slides from curriculum     slides with video

 slides as movie  How To Record in ppt video

Nearpod: This is another great option for those of you who teach using slides, but also is very adaptable to loading small videos you have saved from your computer or found online. The great thing about Nearpod is the wide variety of ways you have to choose from for students to answer questions or interact with the content you create. As you explore this self-paced lesson, be sure to see the variety of student interaction types on slide 3, 5,13, 24, and 26.      

        Student lesson on Nearpod        How To Nearpod video

EdPuzzle: This platform is great for uploading any old or new video you have made or found online and inserting questions to check for understanding during the video. You can upload your classes from google classroom if you wish to, which allows you to keep a gradebook of viewing time and % correct for each video you assign. The video editing tools are simple and wonderful for clipping out little misspeaks or random interruptions. I’ll never have to stop and re-record again! Also, EdPuzzle has the option to set it so students cannot skip over video or questions – your choice.  

       Student lesson in EdPuzzle       How To EdPuzzle video

Screencastify: Every How To video above was made with Screencastify. Like EdPuzzle it allows me to crop out random bits, but it also allows me to add in video pieces, merging them to one relatively seamless video.

Summary chart

Product Use this if Strengths More info here
Powerpoint Recording+You teach from slides

+You want to be able to and edit audio to your slides easily

+You’d like an option to show your face in a small corner screen
+Recording small bits at a time

+The choice to show video of you speaking or omit
Powerpoint support
Nearpod+You teach from slides but you’d like to add your voice to the slide

+You want your lesson to be more interactive

+You want to be able to redo your audio easily
+Lots of variety of interactions available

+Student can move at their own pace, skip things

+Integrates well with google classroom
https://nearpod.com/
EdPuzzle+You want your video to be more interactive

+You want to be able to edit your video

+You want to keep track of student interactions
+You choose whether students can skip things or not

+You can grade student responses and type them feedback

+Integrates well with google classroom
https://edpuzzle.com
Screencastify+You want to be able to edit your video

+You’d like an option to show your face in a small corner screen

+You want to be able to merge two or more videos together
+Stores videos automatically to google drive or your computer (your choice) https://www.screencastify.com/

Distance Learning: The Missing Piece

In mid March 2020, with virtually no time to plan and prepare, schools around the nation shut their doors and moved instruction online. Amazing, wonderful teachers scrambled to learn how to set up google classrooms, record lessons, magically get lessons on usb drives uploaded and assigned in those shiny new online classrooms. They learned or relearned how to assign work digitally through Khan Academy, Delta Math, iReady, or 100 other digital math practice platforms. 

The first weeks were trial and error. Teachers put all 5 classes into one classroom, and told students to upload pictures of the work for each assignment.  At a minimum of 2 photos per student per assignment, 4 assignments a week to 160 students made a huge number of images to be opened 1 at a time and sorted onto the right grade sheets. And some students had trouble uploading into google classroom because, hey, it was new for them too. So teachers found themselves recipients of photos via email, text, and tweet. Some were dropped in the school office on potentially germ covered paper, which meant driving over to pick up and grading with gloves. 

One teacher team that works exceptionally well together but had never used google classroom divided labor. One person made worksheets, one made videos, one photocopied packets for pick up and one made the google classroom. One google classroom. For all 650 students. As a place for info to go out it was fine. But as things started getting turned in, well, it was pretty overwhelming. 

In the midst of all this craziness, and a learning curve that rivaled any pandemic’s exponential growth, the easiest thing to do was to create a learning experience that, as much as possible, mirrored what was happening already in their classrooms. It was comfortable for teachers. It was comfortable for students. At a time when everything about life was different than what it had been one week before, stability and consistency in classroom structure was what we all felt like we needed.

And then it began popping up . . .

What is missing? 

The kids. Being together. The laughter. The high fives. 

The humanity. The heart. The community. 

The sounds of discovery and failure and success!

The reason we went into teaching. The reason we stay. 

We miss our kids. 

And no matter how independent we try to raise our learners to be, they miss us.  Kids who never thought they would miss us, miss us. The feeling is mutual.

And honestly, what were we thinking?? 

Some of us have been recording lessons and providing them online for absent students for years.  How much has that worked for that 6th period baseball player who misses 2 days a week all spring? Uni-directional imparting of information, no matter how slick your videoing or screen casting skills, can never replace the richness of our classroom communities. And at this time, when things are scary, and resources are scarce for some of us, when life itself seems uncertain, maybe it is this community that is the most important thing to keep constant for our students

How do we make room for humanity in our digital classrooms?

  1. Be intentional about connecting personally. Take time to ask, “How are you doing?” communicate back and forth with students when they take you up on those opportunities and share with you. One of my favorite ways right now is using this great set of distance learning starter screens from Desmos. Turns out editing a Desmos activity or creating one of your own is not very hard.(Who knew!) Choose a slide or two each week to give your students a chance to share if they need to. If not Desmos, give them a writing prompt or two to chose from each week.  They can’t just hang after class to talk. Let them know your door is still open.
  1. Allow students some flexibility and choice. We are in a time where we have so little personal control. Give students the opportunity to choose which way they are going to show they have learned something. Hyperdoc lessons are a great way to build in self-pacing flexibility and/or activity choice.
  1. Build in opportunities for creativity and play. Learning activities don’t have to look exactly like a math book. There are lots of ways to practice the mathematics they should be learning in creative and playful ways. And because creativity and play are two well proven stress relievers, adding opportunities for those in your classwork is taking care of your students in a uniquely human way. 

“When we are in a condition of uncertainty, whether it’s about when we can return to work, when schools will reopen, or if any of us, family members or friends are sick, play is a very effective approach to deal with uncertainties, cope and engage in stress relief. Research says that play and creativity help to cope with changes in everyday life, it enhances our subjective well-being and releases positive energy to think about alternatives.”

 –DR. BO STJERNE THOMSEN
  1. Make room for mistakes and second chances. I know they are moving ever closer to adulthood, and teaching them responsibilities and natural consequences is important. But right now is a time to hold a little more loosely to those parts of our teaching.  Instead take the opportunity to teach them about kindness and grace. We as teachers may never know all the extra stressors that are attacking each child’s home life. 
  • Do they have a parent who is separated from the family because they are a health care provider?
  •  Is a relative or loved one who is far, or even in the home, critically ill or especially endangered by this pandemic? 
  • Have one or both adults in the home lost their jobs? 
  • Do they have new responsibilities as an instructor of younger siblings? 
  • Are they simply a child that takes the worries of the scary world we live in deeply to heart? 

Any of these things could affect their ability to spend time on learning, or the likelihood of  the learning they spend time on sticking with them. It is time for grace.

And honestly, it is time to spiral back to things again and again. Let’s do less, but do it with love, playfulness, humanity and grace. 

Face the fact that students might not learn all of the math that you would have taught them if this was a different year. Embrace the fact that you have more to give them than facts and formulas. Remember why we stay in this stressful, crazy, exhausting profession and give yourself permission to make caring for your students the first priority during this once in a lifetime moment in your teaching career.

All in with OUR/IM: A day in the life- Grade 8 Unit 7, Lessons 9-11


“Is there anywhere close we could see this in action?”

“Is there maybe a video that could help us imagine how this looks with kids?”

“How do these lessons work on a block schedule?”

“The lessons seem so scripted. I need to be able to adjust and make a lesson my own, and I am not sure that works with this curriculum.”

I just observed a wonderful lesson on a 113 minute block that answered so many of these questions beautifully. The teacher, Ms. D, agreed to let me share it with you.


Previous day:

Lesson 7 with a quick peek at 8.

During announcements:

Students read and annotate lesson 9 summary.
The teacher leads discussion: “What did you chose to circle or make note of?” etc.
She focuses students on middle line:

“The advantage of using powers of 10 to write large numbers is that they help us see right away how large a number is by looking at the exponent.”

and the final paragraph, circling: easier and avoid errors.

This, Ms D said, is the why of what we are learning today.

Opening Discussion:

To open the day they discussed together Lesson 9 Practice Problems 1 and 2. Problem 1 was a chance to check in on vocabulary for large and small numbers. During problem 2 she focused on all the different ways students could come up with to express each number as a multiple of a power of ten, and had lots of discussion until they felt comfortable moving back and forth.

Pro move– when students misspoke, she wrote exactly what she heard, and invited classmates to agree or disagree. This brought out simple things like the difference between “8 to the 7th” and “8 x 10 to the 7th”

As they finished each part a – e, the teacher circled the answer that was written in scientific notation without defining what that meant and said they would talk about definition later. On part f, she asked students to decide which was scientific notation. They were able to see the pattern and the need, since otherwise there are so many right ways. (MP8 in action)

Part 2:


Then she moved to 10.1. After a first round circulating and checking students work, she brought up a common misunderstanding she was seeing, and discussed the importance of having the tick marks evenly spaced. She showed that labeling with powers of 10 created tick marks where the first two were 10 apart (from 0 to 10), and the next two were 90 apart (from 10 to 100), etc. She asked, “How many tick marks are there?” “What if the last number was 20? (cover 10^7 with a post-it that said 20). A student was able to suggest dividing by 10 since there were 10 tick marks, and they successfully labeled the number line counting by 2s. Then they went back to the number line ending with 10^7, and applied the same process of dividing by 10. Ms D wrote out the division problem, and asked students to apply exponent rules to simplify. They found that they needed to count by 10^6. At this point she translated, “That’s 1 million, right? Can you count by one million up to 10 million?” Students all began counting out loud. She wrote 1,000,000 and 2,000,000 over the first two tick marks. “How could we write those as multiples of a power of 10?” They did those two together and then she asked them to complete numbering that line using multiples of a power of 10.

From here they moved to 10.3 (10.2 appears in the Desmos activity they did later). Ms. D asked student to work silently to express each number as a multiple of a power of 10. After a few minutes working with her circulating, she asked them to convert each of their answers to be written with same power of 10, to make them easier to compare. “Share your answers with your partner. Did you both chose same power of 10?” and finally, “Let’s all change to 10^8, to match number line we will use next.”
She showed the zoom in digital app and asked how they could label the zoom-in line. A student quickly suggested using decimals, and Ms. D encouraged them to complete that labeling with their partner.

Zooming out the rest of the way using the applet gives and chance for them to check their work ( see below). From here students added the points to the line (#3) and the class discussed #4-5.

Desmos Application:


From here they moved to this Desmos activity (If you haven’t played this yourself yet, follow the link and check it out!). Students worked individually all the way through, sometimes going back and revising their thinking as they saw what classmates had entered ( in slide 3 for instance). Occasionally a quiet collaborative conversation broke out.
Students who had looked less engaged during class discussion were super engaged and talking math 100% during this activity. For students who finished early, she had them listen with ear buds to Mr. Aaron’s lesson 11 video. On the last slide of the Desmos activity, which was her cool-down for the day, all but 2 students correctly answered the final question by themselves.

If your counting, that was 3 lessons with 94% mastery in one block.

All In with IM – Grade 8 Unit 6 Associations in Data

True confessions:

I thumbed through Unit 6 when the books were first delivered and saw it included scatter plots and two way frequency tables. No problem. I’ve taught those things before. And scatter plots means line of best fit, so we’ll be reviewing equations of line and slope shortly before testing. Perfect.

And I put the book away.

In our first year we ended up moving unit 6 to last, because unit 8 seemed more important to get in before testing. So it turned out we barely touched any of unit 6 the first year, and definitely did not take time to get the big picture of the unit.

So here I am in year 2, finally digging into Unit 6. And I can say there was a lot I didn’t get first time around. Let’s begin with the title: Associations in Data. This title fits the two ideas I formally thought of as separate into one overarching concept, and that understanding frames everything you are doing in the unit. (I wish this was a little more explicitly discussed in the unit overview – maybe next edition??).

In grade 6 students work with displaying and analyzing numerical data around a single attribute. They recognize that data can be described in terms of it’s central tendency and it’s spread, and use line plots, box plots, and histograms to display the data and make visible these important features. Early in the unit, students are asked to recall these terms as ways to display single variable data sets.

What is different in 8th grade is the addition of a second set of data that may or may not be associated in a predicable way with the first set. When the data is numerical, we can use a scatter plot to see if there is a predictable pattern or association between set 1 and set 2. If the data is categorical, we can use the two way frequency table and relative frequency to determine whether there is an association we can use to make predictions.

Numerical Data and Associations

Using numerical data on a scatter plot we can ask does the daily high temperature have any connection to the number of snow cones sold on that day? We might say:

  • As temperature increases, the number of snow cones sold increases.

We might describe the association using more precise mathematical vocabulary:

  • There is a positive linear association between temperature and number of snow cones sold.

Or we might describe the association using the equation of a line of best fit:

  • The relationship between temperature, T, and cones sold, c, can be modeled using the equation T = 2c -70.

Or potentially just in terms of the slope of the line of best fit:

  • Two additional cones are sold for each 1 degree increase in temperature.

In all cases we are implying that there is an association between that two sets that allows us, knowing something about 1 set, to make a prediction about the other set.

(So far, nothing dramatically different from what I expected, except perhaps the opportunity to describe the relations ship in terms of just the slope of the line of best fit.)

Below are some additional practice and review problems we made to focus on this part of the unit. Questions circled in red emphasized using the slope (and units) to describe the association. Our first time working through the unit test we were worried that students might struggle with that. After working through the unit I see this idea comes up a fair amount, but I do like the chance to re-emphasize the meaning of slope of a line in terms of units.

Graphs That Don’t Begin At (0,0)

Sometimes it is just not convenient for a graph to begin at (0,0). A graph where the x axis is labeled with the year is a perfect example.

Image result for average home price vs year

Watch for situations in the unit where this comes up. The first is in the lesson 2 summary, then twice in lesson 3 and 5 times in lesson 4. This same graph and context from lesson 2’s summary comes up in the lesson 3 and lesson 4 summaries. The fact the graph is familiar when you summarize 3 and 4 lets students focus on the mathematics from that day. Don’t skip the Lesson 2 graph – be sure to deal with the “not (0,0)” issue when it first arises.

Below part of our review problem 6 is shown, where we took some time to focus on the fact that not all graphs begin at (0,0). (see green circle). There is a spot on the test where the line of best fit exits the left side of the graph above the x axis, but the y intercept is actually negative. We added this problem to create a discussion about y-intercepts that don’t show on the piece of graph that is given.

Categorical Data and Associations

Lessons 9 and 10 focus on categorical data. My teaching in the past has focused primarily on displaying this data using bar graphs and two way frequency tables, but in this curriculum, the question is consistent throughout the unit: Is there an association between the two sets of data? In categorical data, this can be interpreted: If we know a subjects answer to question A, can we predict their answer to question B? How reliable is that prediction?

Lesson 9 begins with a chance for students to notice such and association. Students who do not play sports are more likely to watch a fair amount of TV.

9.2 introduces students to 3 ways that data might be displayed: two way frequency tables, bar graphs, and segmented bar graphs. There is a short card sort included in 9.2 to let student practice matching data sets that are displayed differently. In activity 9.3, students learn to find relative frequencies from data in a two way frequency table. they are asked to make conclusion about whether an association exists based on these relative frequencies.

The next day, they will actually create segmented bar graphs with these relative frequencies and most students will find the visual helpful in determining the association. If the percents are very close to the same in each segmented bar, there is no association to help make a prediction about one thing given the other.

Here are a few practice and review problems we made for this section of the unit:

The questions circled in blue really ask the same thing in two different ways, and are meant to create a discussion around what it means for there to be an association between the data. Several of the other questions offer chances to continue this conversation.

Links to questions pictured in this post: review as pdf

review word version

extra practice

All in with IM – Grade 8 Unit 7 Exponent and Scientific Notation Practice

Here’s a quick resource for exponent and scientific notation practice that aligns nicely with Illustrative Math / Open Up Resources Grade 8 Unit 7.

I first saw the “One Incorrect” activity model on Greta B’s blog Count It All Joy. I believe her original inspiration is from the work of Don Stewart  here.

Since Unit 7 includes so much “Which of the following are the same as . . . ?”, this practice structure seemed like a perfect fit. Use whichever pages fit your needs. Note the open middle style appear on this unit assessment. Chose the level of openness you are comfortable with.

Some details on construction: Each sheet has a picture over the top of the actual editable equations/text. So if you would like to edit problems, or make a different page for each group and have students rotate and find the “one incorrect” on their classmate’s creations, you can easily duplicate a slide and edit it.

Tips for those feeling pressed for time as they approach unit 7:

Lesson 1-3 can be condensed. Use the pre-assessment to decide how much. 2 days? 1 day?

Lesson 4 and 5 are worth slowing down on a bit. The tables are amazing in lesson 5. Take time to fully understand all that first table does for you and reference back to it through the lesson.

Lesson 6 and 7 extend exponent rules to other bases. If you have an anchor poster for your work from lessons 1-5, update it here. See the note below from the Activity Synthesis for lesson 6, activity 2:

I would do this by using post-its to replace the 10’s with 2’s, then 5’s, and eventually rewriting with x’s. These are the lessons where lots of exponent rule practice is built in.

Lesson 8 and Lesson 9: Great lessons, but if time is an issue and you are able to revise a test question, this is a spot where the time desperate can cut. Note that test question number 6 part c is covered in lesson 8.

If you are minimizing lesson 9, be sure to include a moment for big and small number vocabulary, maybe including an anchor chart for reference.

Lesson 10: Spend the time here. There are some amazing resources to explore with this lesson.

For Activity 10.2, check out the applet in the on-line materials for placing numbers on the number line. This is something to consider having students interact with in pairs.

Also in Lesson 10, Activity 3 has a must-use applet to visualize the expanding number line.

Lesson 11 goes through the same thinking, only with very small numbers. Desmos has a activity, The Solar System, Test Tubes, and Scientific Notation, that combines lesson 10 and 11, as well as some fun Scientific Notation practice.

In the Activity attached at the top, there are also 4 pages practicing the second half of the unit.